


VIDEO and FREE TRIAL
Qlucore Omics Explorer video
Qlucore Omics Explorer free trial
Qlucore Omics Explorer delivers powerful, flexible and easy-to-use visualization of big data for fast analysis and results. It gives you better control of your data, reveals potentially more patterns and insights at a glance, makes it more efficient to generate, validate and report results and provides context for asking better questions and optimizing bioinformatician support.
Qlucore Omics Explorer is designed on the principle of dynamic data management and visualization to give every scientist or clinician control of their own experiment data. The software is intuitive to use, and responds instantly to input—smoothing your workflow by eliminating disruptive lags. Qlucore Omics Explorer is an off-the-shelf tool that combines the complex capabilities of custom programming with the familiarity and ease of use of commercial programs. It’s the simplest, most accessible power tool for managing the high volumes and complexities of today’s experiment datasets.
Combining powerful statistics and instant visualization generates powerful analysis options and exciting results of any type of omics data.
Researchers without bioinformatics expertise can capably work with today’s most advanced analysis models, templates, filters and statistical methods to instantly capture more value from their data and advance their work in the most promising directions.
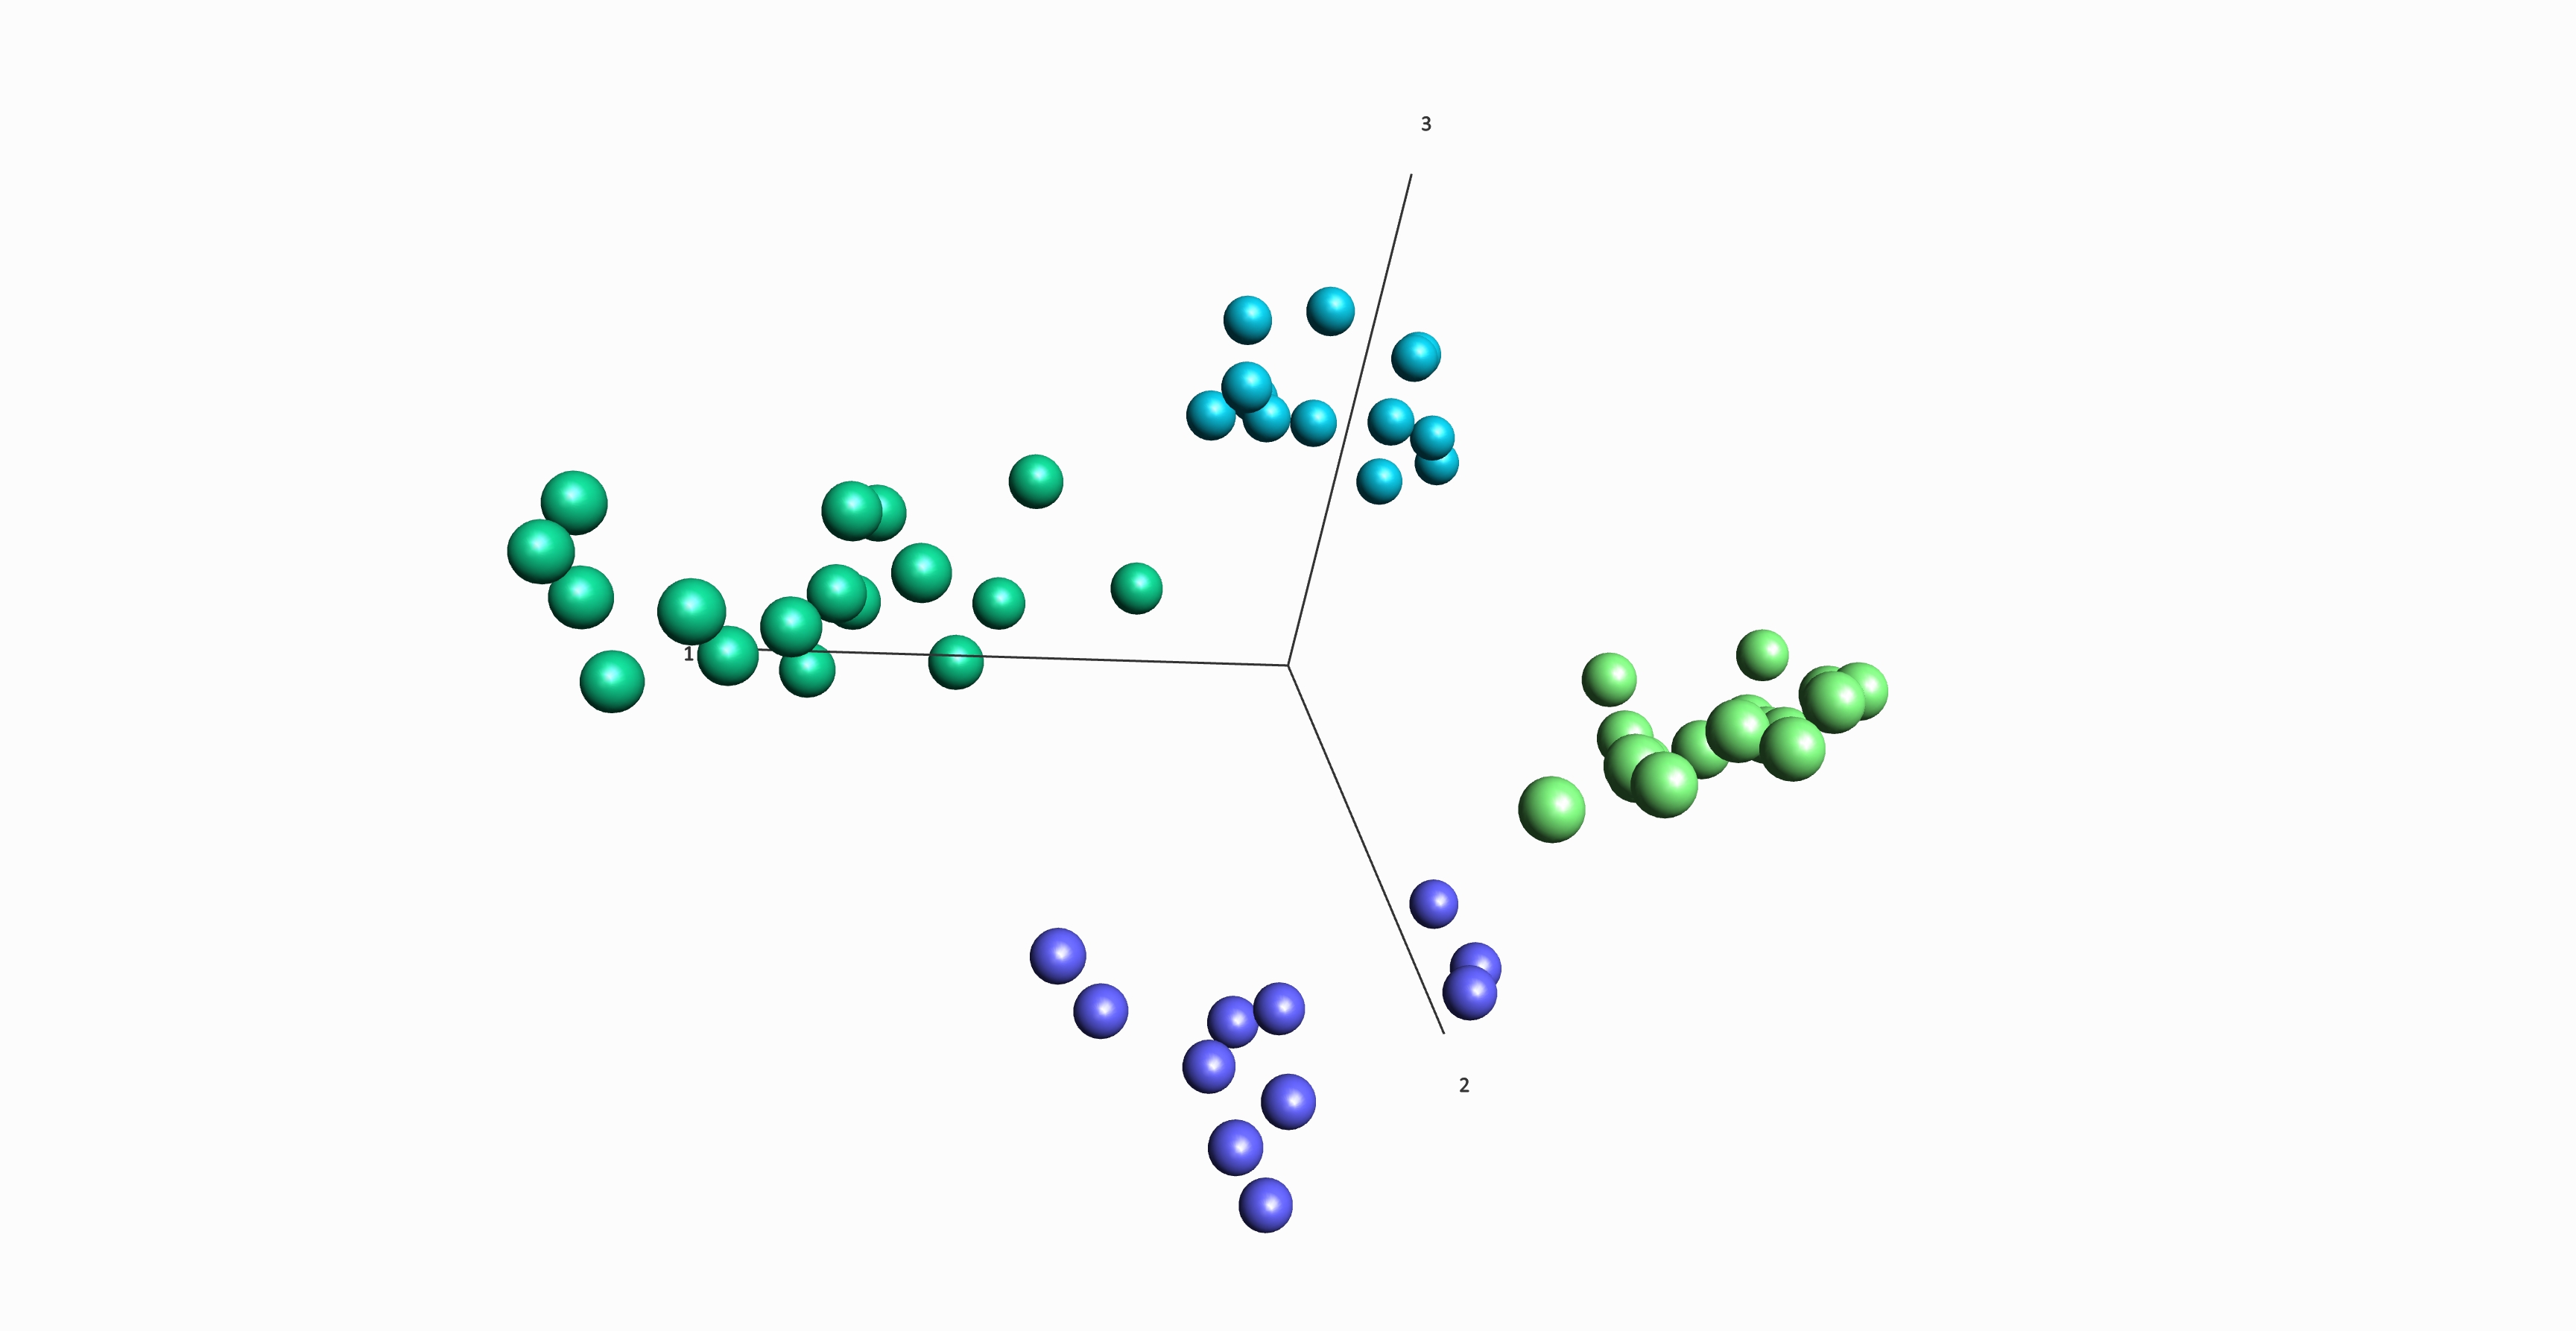
Instant visualization of data gives a comprehensive overview and lets you easily detect signals and patterns that lead to new findings and results.
Work interactively with active plots from one or multiple data sets—results are shown immediately in all open plots, making it easy to visualize several aspects of data simultaneously
Tailor your workflow and exploration to meet your specific needs.
Qlucore Omics Explorer provides advanced processing and analysis features that enhance results and support cutting edge research. While being simple and intuitive enough to give non-experts full control over their own experiment data in real time.
Powerful tracking and report-generating features make validation and sharing simpler.
Sharing of informative results for collaboration or publication is easy and flexible, with options including images in a wide range of formats, variable lists with or without data, videos, detected variants, PCA components, covariance matrices and more.
Work interactively with active plots from one or multiple data sets—results are shown immediately in all open plots, making it easy to visualize several aspects of data simultaneously.
A wide selection of 2D and 3D plots are available to enhance exploration and analysis and show results.
Qlucore Omics Explorer is available both for local installations and as a cloud service. This makes deployment easy and flexible.
Qlucore Omics Explorer is easy to use and easy to get started with. Check out How it works for details.